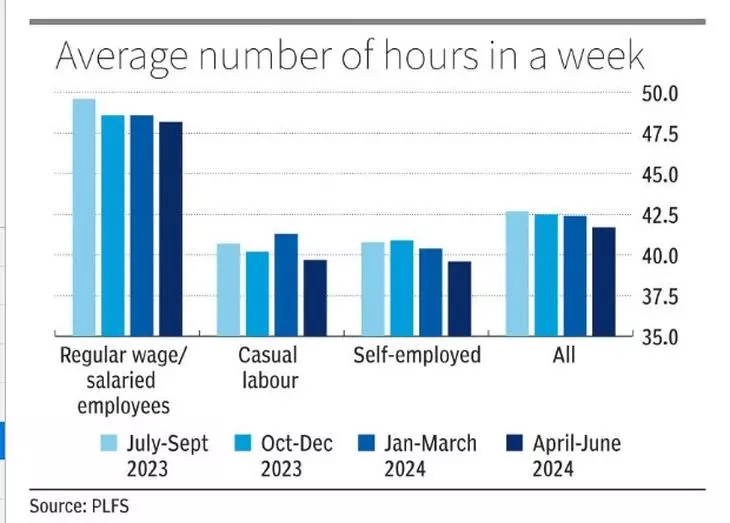
Recent Periodic Labour Force Survey (PLFS) has found that regular salaried employees work for longer hours per week than casual labour or the self-employed.
According to PLFS Annual Report for July 2023-June 2024, average number of hours actually worked in a week by regular wage/salaried employees was 48.2 during April-June period as against 39.7 hours for casual labour and 39.6 hours for the self-employed. Similar trend was observed during previous three quarters (July-September 2023, October-December 2023 and January-March 2024). Results of PLFS Annual Report are based on a survey conducted among over 4 lakh persons (over 2.4 lakh in rural areas and over 1.7 lakh in urban areas).

Also read – Zeta onboards HR veteran Shubhayu Sengupta as Chief People Officer
Key findings
- Labour Force Participation Rate (LFPR) in usual status (ps+ss) for persons of age 15 years and above was 60.1% during July 2023 – June 2024. The same for male and female was 78.8% and 41.7% respectively.
- Overall LFPR in usual status (ps+ss) for persons of age 15 years and above has increased from 57.9% during July 2022 – June 2023 to 60.1% during July 2023 – June 2024. LFPR for female of age 15 years above in usual status (ps+ss) has increased from 37.0% during July 2022 – June 2023 to 41.7% during July 2023 – June 2024. For male of the same age group LFPR in usual status (ps+ss) increased from 78.5% to 78.8% during the same time span.
- Worker Population Ratio (WPR) in usual status (ps+ss) for persons of age 15 years and above was 58.2% during July 2023 – June 2024. The same for male and female was 76.3% and 40.3% respectively.
- WPR in usual status (ps+ss) among female of age 15 years and above has shown an increase from 35.9% during July 2022 – June 2023 to 40.3% during July 2023 – June 2024. The overall WPR among persons of the same age group in usual status (ps+ss) has increased from 56.0% during July 2022 – June 2023 to 58.2% during July 2023 – June 2024.
- Unemployment Rate (UR) in usual status (ps+ss) was 3.2% for both male and female of age 15 years and above during July 2023 – June 2024. While the same for male has shown a marginal decline from 3.3% during July 2022 – June 2023 to 3.2% during July 2023 – June 2024, among female it has increased from 2.9% to 3.2% during the same time span.
Experts feel this could be mainly due to corporate work culture involving heightened demands for productivity, tight deadlines, and rising client expectations.
There are other indications from the survey, especially the dynamism it reflects in terms of the work hours of different classes of employees.
Stay connected with us on social media platforms for instant updates click here to join our LinkedIn, Twitter & Facebook


